Unleashing the Power of Clean Data: A Guide to Cleaning Financial Data from Square Website and adding features
While square.com has many built-in analytics tools, it does not paint the full picture of a business’ data. Significant cleaning is required to make the best use of the data. I will go into detail of how I cleaned the data from a brewery’s square account to make it useable for further analysis.
Importing
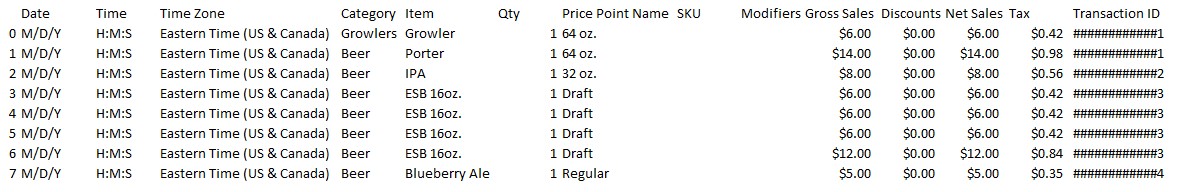
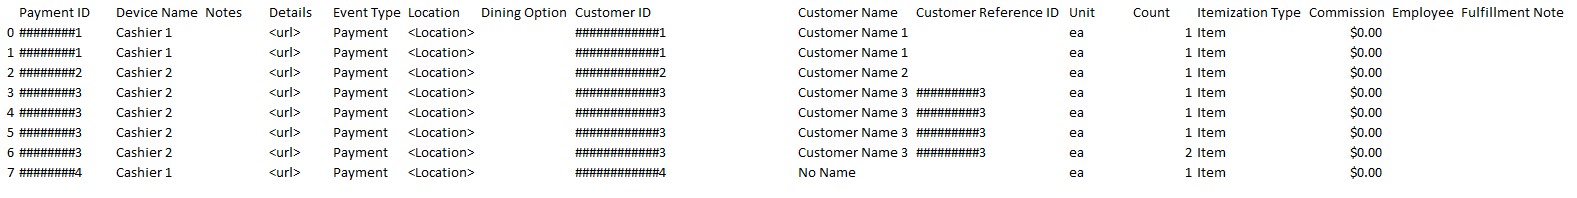
There is an option to download csv files from square.com. These will be for individual items sold and span from January 1st of the year in question to January 1st of the following year.
                    import pandas as pd
                    import datetime as dt
                    import numpy as np

                    #importing square data
                    sales_2019 = pd.read_csv('data/items-2019-01-01-2020-01-01.csv')
                    sales_2020 = pd.read_csv('data/items-2020-01-01-2021-01-01.csv')
                    sales_2021 = pd.read_csv('data/items-2021-01-01-2022-01-01.csv')
                    sales_2022 = pd.read_csv('data/items-2022-01-01-2023-01-01.csv')
                    sales_2023 = pd.read_csv('data/items-2023-01-01-2024-01-01.csv')

                    df_list = [sales_2019, sales_2020, sales_2021, sales_2022, sales_2023]
Sales data for the years in question is imported, converted into dataframes and the resulting dataframes are put into a list.
Initial Cleaning
                    monetary_columns = ['Gross Sales', 'Discounts', 'Net Sales', 'Tax']
                    for df in df_list:
                        for col in monetary_columns:
                        #fixing monetary values
                            df[col] = df[col].str.replace(',', '', regex=True)
                            df[col] = df[col].str.replace('$', '', regex=True)
                            df[col] = df[col].astype('float')

                        #changing applicable columns to datetime
                        df['Date'] = pd.to_datetime(df['Date'])
                        # df['Time'] = pd.to_datetime(df['Time'], infer_datetime_format=True)

                        #adding new columns based off datetime
                        df['year'] = df['Date'].dt.year
                        df['month'] = df['Date'].dt.month
                        df['month_name'] = df['Date'].dt.month_name()
                        df['day'] = df['Date'].dt.day
                        df['Day_of_Week'] = df['Date'].dt.day_name()
                        df["period"] = df["year"].astype(str) + "." + df["month_name"].astype(str)
                        df['Time'] = df['Time'].apply(lambda x: dt.datetime.strptime(x, "%H:%M:%S"))
                        df['hour'] = df['Time'].dt.hour

                        #addition of new columns
                        df['Customer Name Init'] = df['Customer Name'].str.replace('[^A-Z]', '', regex=True) #changing customer names to initials for privacy
                        df['Customer Name'] = df['Customer Name'].str.replace(',', '', regex=True)
                        df['unit_price'] = df['Gross Sales'] / df['Count'] # adding a price per unit of product column
Customers without a name are understood to be cash paying customers and cannot be tracked.
                    # Fill in missing values
                    df['customer_name'].fillna('NoName',inplace=True)
                    df['customer_init'].fillna('NN',inplace=True)
Mapping item types
Since methods of entering the item type changed throughout the years, it was necessary to create dictionaries to link the ‘item’ to a beer name (i.e. IPA, Chocolate Stout) and a product type (i.e. draft, keg, can).
                    #dictionary import to map items to product types and beer names
                    import ast
                    def read_text_file(file_path):
                        with open(file_path, "r") as file:
                            content = file.read()
                        return content
                    file_path_ names = "data/names_dict.txt"
                    file_content_ names = read_text_file(file_path_ names)
                    names _dict = ast.literal_eval(file_content_ names)

                    file_path_product = "data/product_dict.txt"
                    file_content_product = read_text_file(file_path_product)
                    product_dict = ast.literal_eval(file_content_product)
These dictionaries could then be mapped to create new columns for the beer names and the product type.
                    df['beer_ names’] = df['Item'].map(names_dict)
                    df['product_type'] = df['Item'].map(product_dict)
Compiling into a single dataframe
used concat, dropped unneeded columns – as Customer ID is not consistent have to make my own later, renamed columns to be in keeping with proper formatting
                    df = pd.concat([sales_2019, sales_2020, sales_2021, sales_2022, sales_2023],
                                join='inner', axis='rows')

                    df = df.drop(['Payment ID', 'Customer ID', 'Customer Reference ID',
                                'Price Point Name', 'Discounts', 'Net Sales', 'Tax',
                                'Category', 'Commission', 'Employee',
                                'Unit', 'Dining Option', 'Details', 'Qty', 'SKU',
                                'Modifiers Applied','Location',
                                'Itemization Type', 'Fulfillment Note', 'Notes',
                                'Device Name', 'Event Type', 'Time Zone'], axis='columns')

                    df = df.rename(columns={"Date":"date",
                                            "Time":"time",
                                            "Item":"item",
                                            "Gross Sales":"gross_sales",
                                            "Transaction ID":"transaction_id",
                                            "Customer Name":"customer_name",
                                            "Customer Name Init":"customer_init",
                                            "Day_of_Week":"weekday",
                                            "Count":"count"})

                    df = df.sort_values(by="date", ascending=True, ignore_index=True)
Addition of more features
Customer ID
                    # addition of customer ID number
                    df['customer_id_no'] = pd.factorize(df['customer_name'])[0]
                    df['transaction_no'] = pd.factorize(df['transaction_id'])[0]
                    df['period_id'] = pd.factorize(df['period'])[0]
Unique transaction IDs needed to further consolidate the data
df = df.sort_values(['customer_id_no', 'date'])
Visit frequency of individual customers
                    df['visit_freq'] = df.groupby('customer_id_no')['transaction_no'].transform('nunique')
                    df = df.sort_values(['date', 'customer_id_no'])
Number of customers on a daily basis
df['daily_no_customers'] = df.groupby('date')['transaction_no'].transform('nunique')
Number of different beers sold daily
                    df = df.sort_values(['date', 'beer_ names'])
                    df['no_styles_sold'] = df.groupby('date')['beer_ names'].transform('nunique')
Addition of features beyond square data
Weather
Weather data might be an important factor in looking at a brewery’s sales on a day-to-day basis. Data for this project was pulled from the closest weather station to the brewery from the National Centers for Environmental Information. It lists the date, the precipitation in inches, snow in inches, the maximum temperature, minimum temperature and the percentage of sun.
After importing the csv and renaming the columns it can be merged with the square data. Any null values in precipitation or snowfall can be assumed to be zero.
                    sales_data = pd.merge(df, weather, on='date', how='left')
                    sales_data['precipitation'].fillna(0,inplace=True)
                    sales_data['snowfall'].fillna(0,inplace=True)
Untappd
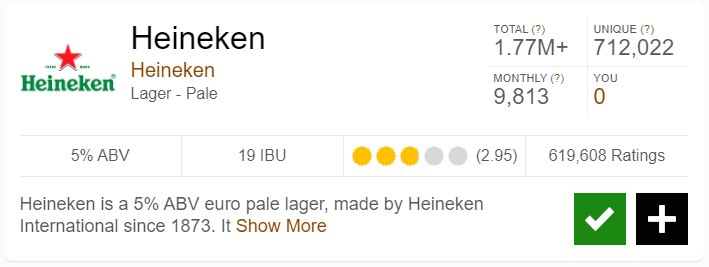
The top social media site for beer lovers is Untappd. A user can log in a beer and rate it. The brewer can add in additional data such as ABV, a description of the beer, and IBU. Data can be exported through a paid account or scraped.
For the purposes of my project, I mapped the Untappd beer styles to an overall style to make fewer categories for easier analysis; for example, ‘IPA – American’ and ‘IPA – New England/Hazy’ are both mapped to ‘IPA’. After importing the csv, verifying the same naming convention for the beer names, and pulling out the features needed, the Untappd data can be merged with the original dataframe on the ‘beer_name’ column created earlier.
sales_data = pd.merge(sales_data, untappd_data, on='beer_ names’, how='left')
Instagram
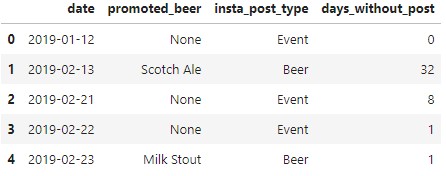
Instagram or other social media data can be used as a feature to indicate whether an event was promoted or if there was some online visibility that attracted customers on a given day. The data can be scraped or, in my case, recorded manually. I wanted to be clear on the type of content that was promoted in a post.
I noted which beer, if any, was promoted in a post, whether the post was a general beer post or promoting an event, and the days since the last post.
sales_data = pd.merge(sales_data, insta_data, on='date', how='left')
After the final merging, the data is ready to be used for further analysis!