Customer Churn at a Microbrewery
Abstract
This study aims to identify the key factors influencing customer retention in a local brewery. The research employed Recursive Feature Elimination (RFE) in conjunction with a Random Forest Classifier (RFC) to analyze various datasets, including sales data obtained directly from the brewery, social media data, and weather data. Through this analysis, several actionable features were identified, which can be implemented promptly to enhance the brewery's financial performance.
Introduction
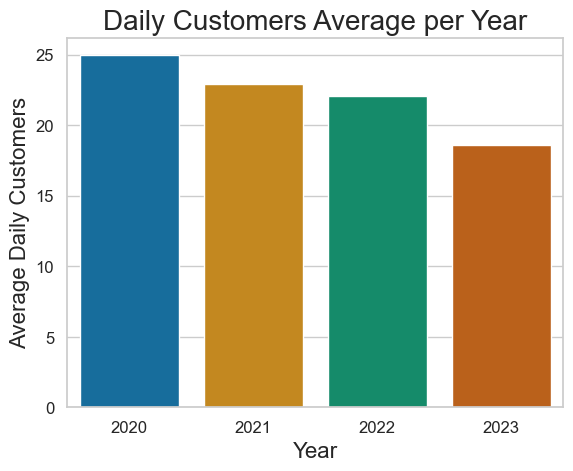
Unique customers (only ones who paid with a credit card can be accounted for, and obviously there are some that pay in groups) have dropped from a daily average of 25 in 2020 to 18 in 2023. Please see RFM LINK for more information.
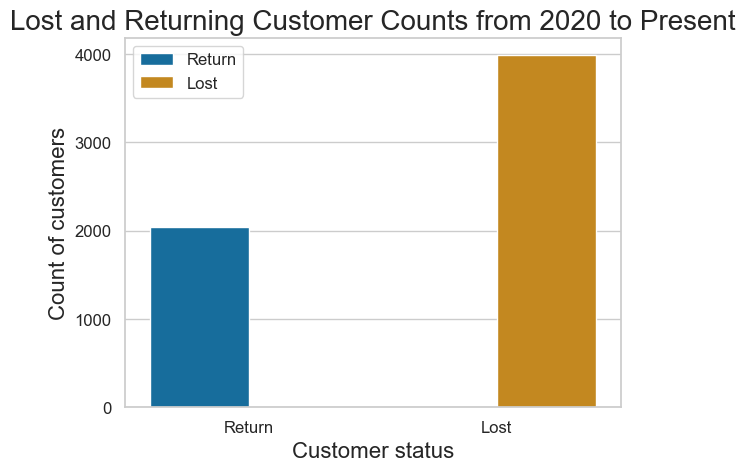
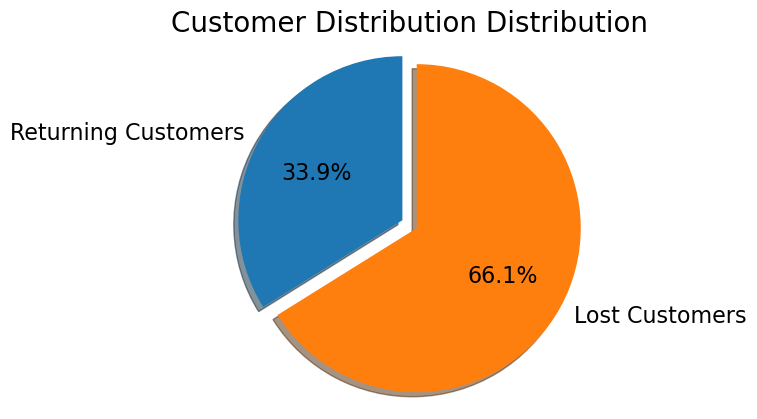
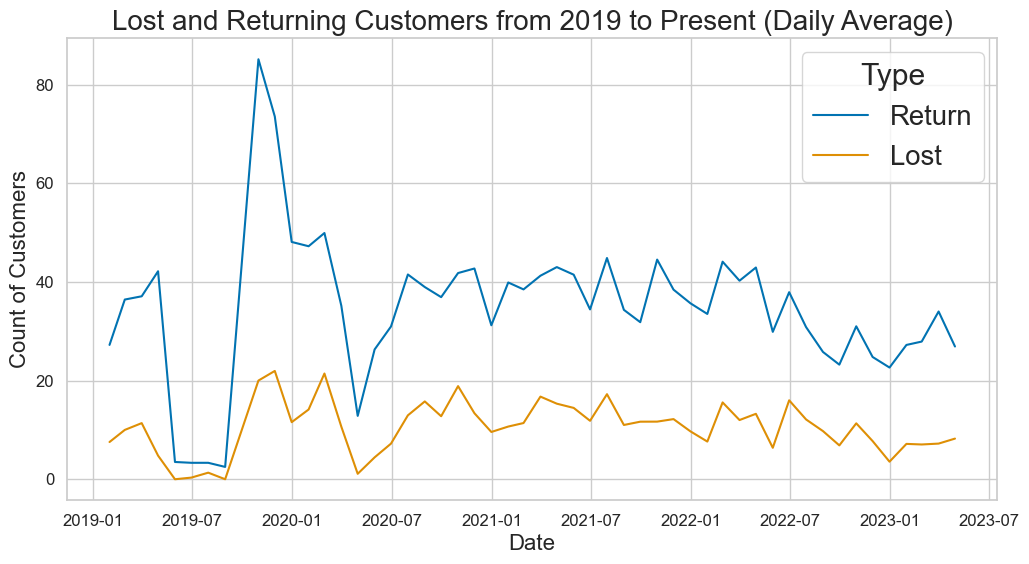
Out of approximately 6000 trackable customers, only 2000 returned. As customers tend to pay on a single tab, this number may be slightly different in reality.
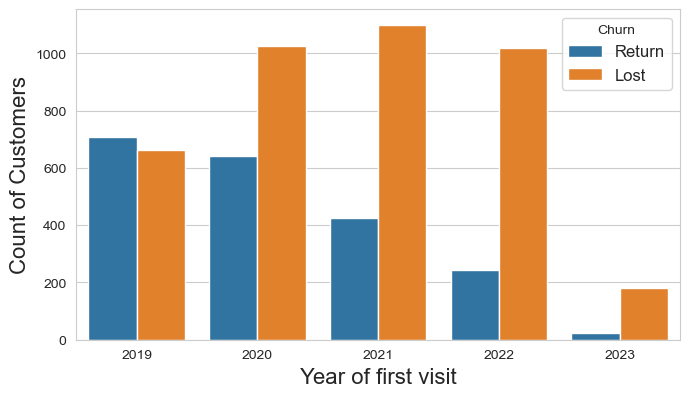
There was an initial surge in sales when reopened post covid but recent decline in sales and number of customers daily. As seen above, the bulk of the daily visitors (on average 80%) are returning customers. Returning customers have been dropping since the summer of 2022.
What impacts the customer's return?
Many factors were considered in predicting the likelihood of a customer returning.
- Gross sales or how much are they spending on a visit?
- When was their first visit?
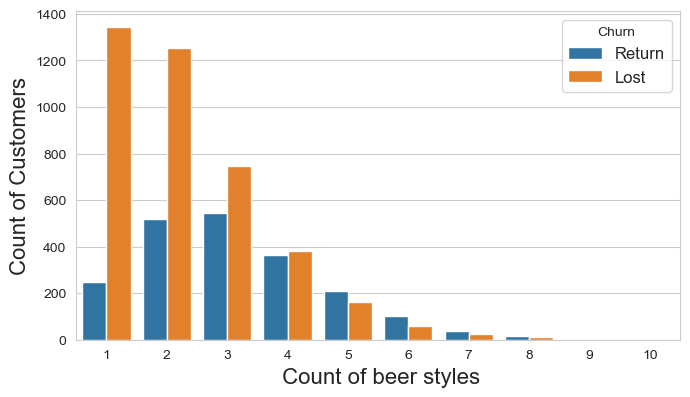
- How many beer styles did they try on their visit?
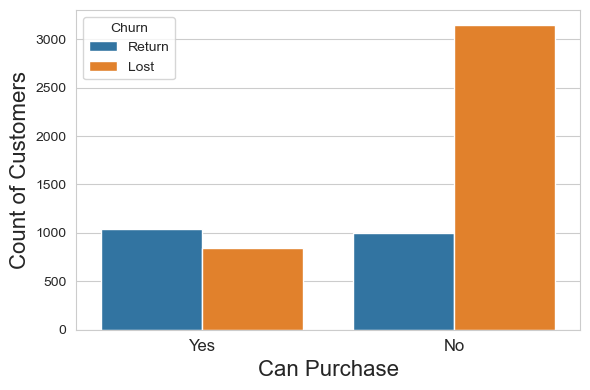
- Did they purchase cans?
- Did they purchase a flight?
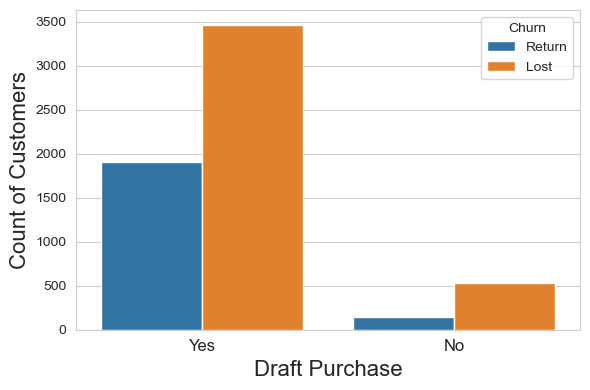
- Did they purchase a draft?
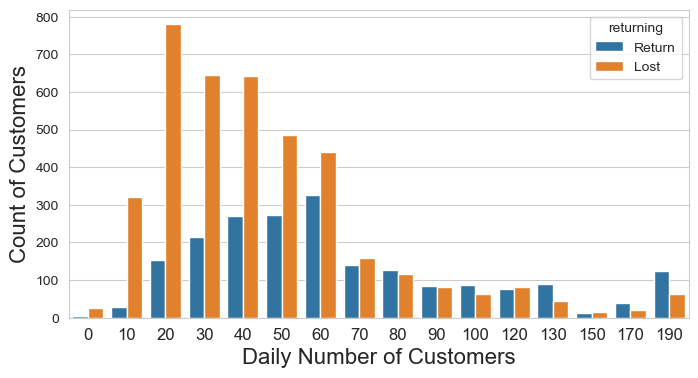
- How many other customers were present that day?
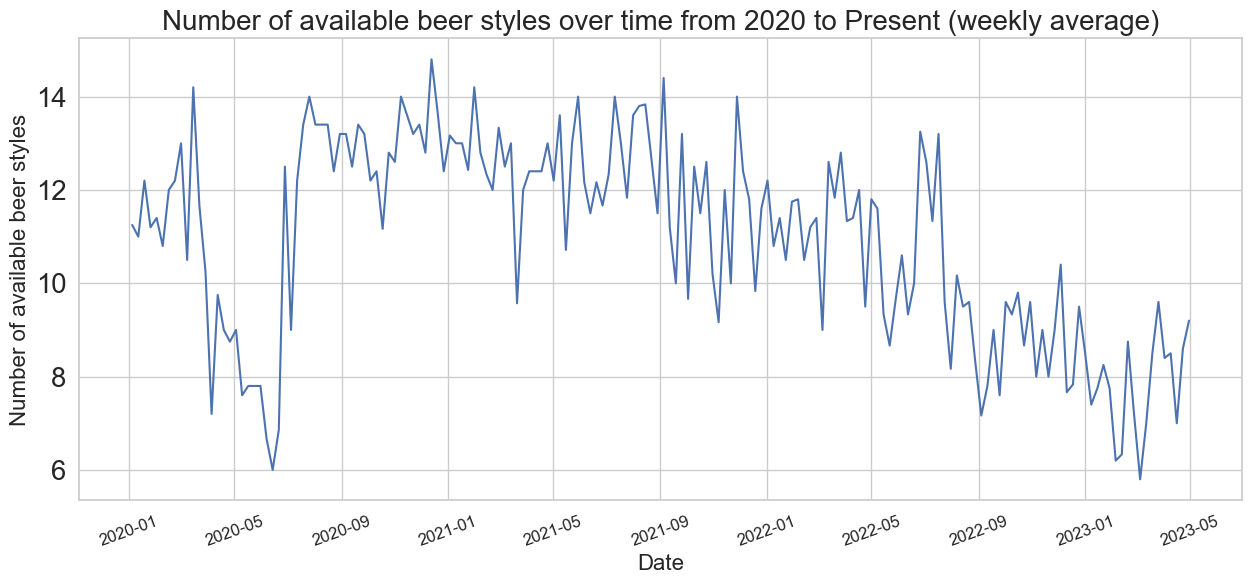
- Were there a lot of beer styles available that day?
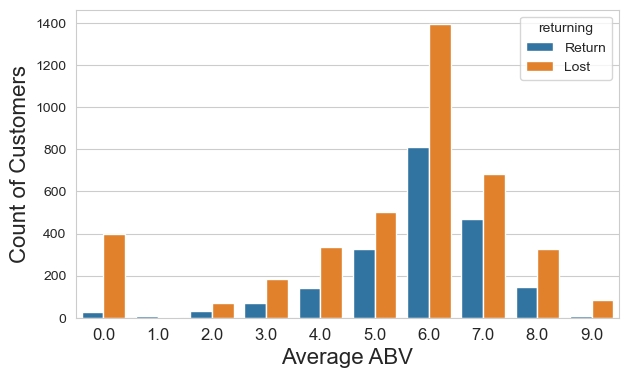
- What was the average ABV of their purchased beers?
- What was the average Untappd rating of the beer they consumed?
- Was there a post on Instagram promoting beers that day?
- Was there an event going on at the brewery that day? This was assumed from Instagram posts.
- How many days since the latest beer release? This was assumed from Untappd data of the date the beer was first checked in.
Plotting churn
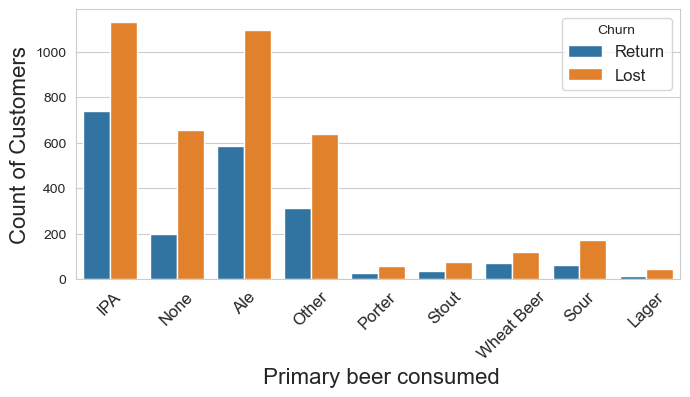
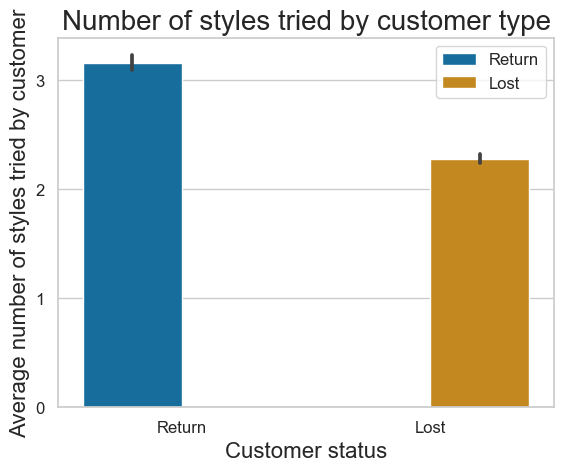
I began digging in further with some exploratory data analysis, plotting the counts of return and lost customers for several factors to see if there were any immediately apparent trends.
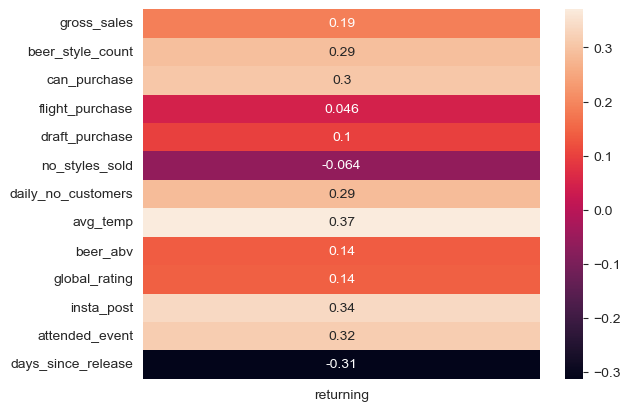
Correlation Matrix
Recursive Feature Engineering
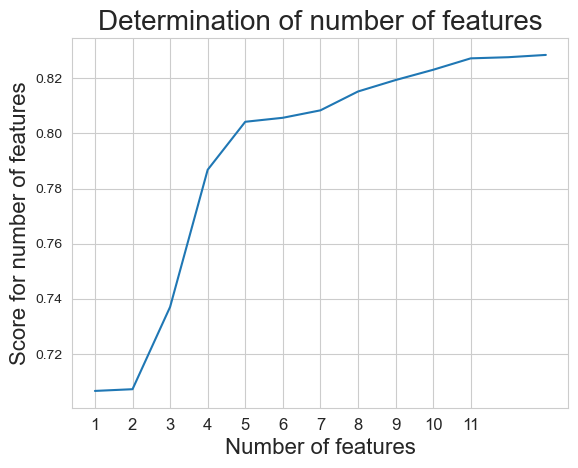
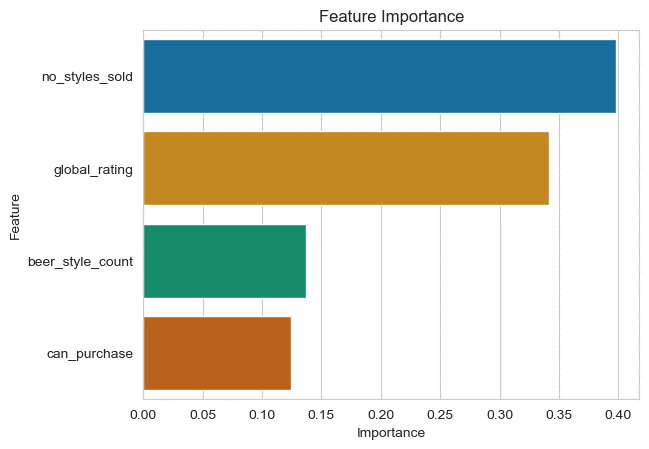
First, I had to choose the number of features to use. I used a pipeline to run a selector and plotted the scores for each number of potential features. There is diminishing benefit to using more than 4 or 5 features so I will use 4 in my model. The features are the global rating of the available beers, the number of styles available on a given day, the number of styles consumed by a customer, and whether cans were purchased.
Predictive Modeling
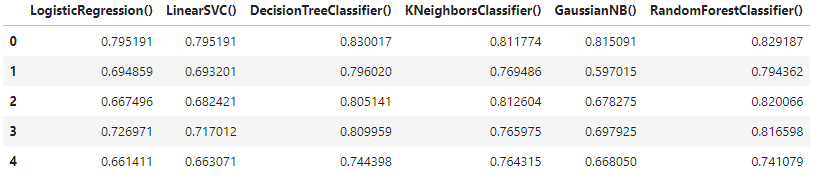
Using the determined number of features, many models were tested and, given the results, Random Forest Classifier was selected for predictive model. kFold scores are shown below.
Hyperparameter tuning and pipeline creation
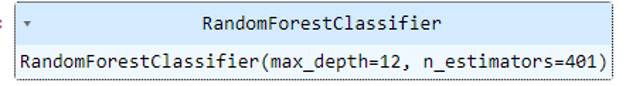
I used RandomizedSearchCV from sklearn to determine the best hyuperparamters. N_estimators, or the number of trees, I found 401 was the best number.
Max_depth, or the max number of levels in each decision tree, I found 12 was the best fit.
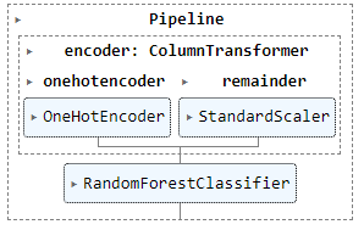
I created a pipeline for my model and used standard scaler on my features
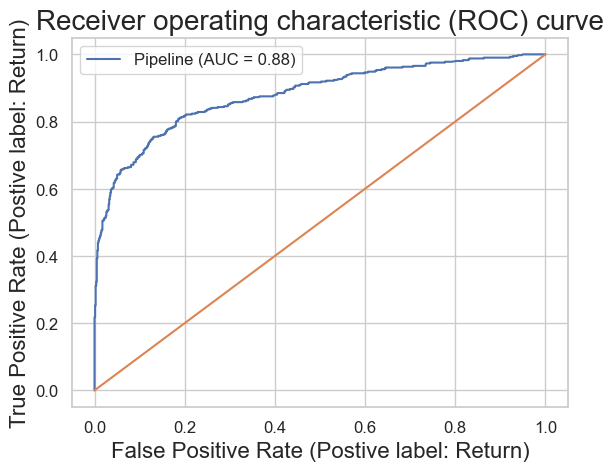
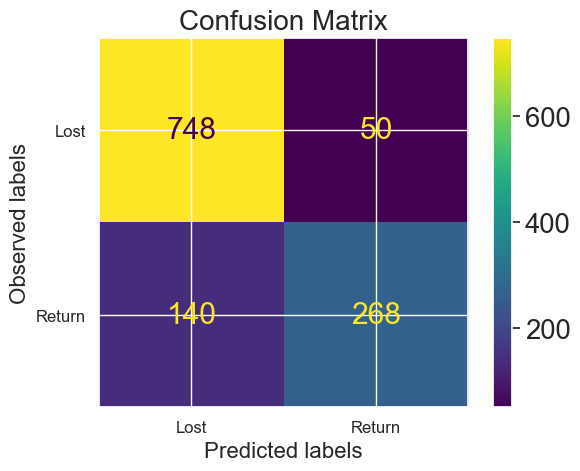
Results
Calculating the accuracy from the confusion matrix gives 85% accuracy. the ROC curve gives an AUC (area under curve) of 0.88. From these results I would say this is a good model and a customer's return could be predicted.
The image below shows the feature importance. Nothing here is really unexpected: having high quality beers and a wide selection is key to bringing people back.
Conclusions
As seen in the individual beers section, the number of beers available has decreased over time which can also account for reduced customer counts.
Quality of the beer is difficult to account for via Untappd ratings as seen in the individual beers section.
Purchasing of cans being an important feature indicates the can fridge was likely a good investment.
The selected features that determine a customer's return are actionable and will be implemented. The quantity of beer styles both consumed and available, the overall quality of the beer (according to customers using Untappd) and the purchase of cans were all key factors. The taproom investment of a can fridge was likely worthwhile and pushing new customers towards flights could be helpful. The brewery tends to focus on having events which, although there is the occasional outlier with high attendance, does not seem to be too impactful overall. It may be advisable to push new customers to start with a flight (a selection of 4 small pours) to get them to try more styles. Currently flights only account for 0.7% of the gross sales.